Task-level monitoring#
In the Execution view, selecting a task within the list will open the right panel. In that panel, you will find the View Utilization button:
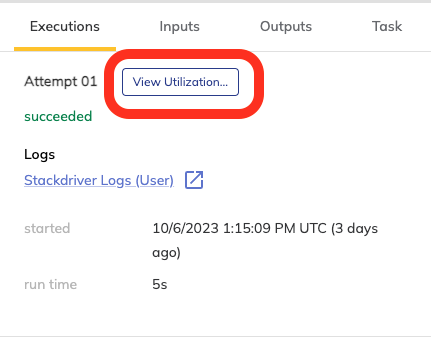
Clicking this will take you to the task-level monitoring page:

Execution Resources#
This tab displays details about the resources used by this specific task. As an example, let’s say that the definition of this task in your Python code has the following task decorator:
@union.task(
   requests=Resources(cpu="44", mem="120Gi"),
   limits=Resources(cpu="44", mem="120Gi")
)
These parameters are reflected in the displayed Memory Quota and CPU Cores Quota charts as explained below:
Memory Quota#

This chart shows the memory consumption of the task.
Limit refers to the value of the
limits.memparameter (thememparameter within theResourcesobject assigned tolimits)Allocated refers to the maximum of the value of the
requests.memparameter (thememparameter within theResourcesobject assigned torequests) the amount of memory actually used by the task.Used refers to the actual memory used by the task.
This chart displays the ratio of memory used over memory requested, as a percentage. Since the memory used can sometimes exceed the memory requested, this percentage may exceed 100.
CPU Cores Quota#

This chart displays the number of CPU cores being used.
Limit refers to the value of the
limits.cpuparameter (thecpuparameter within theResourcesobject assigned tolimits)Allocated refers to the value of the
requests.cpuparameter (thecpuparameter within theResourcesobject assigned torequests)Used refers to the actual number of CPUs used by the task.
GPU Memory Utilization#

This chart displays the amount of GPU memory used for each GPU.
GPU Utilization#

This chart displays the GPU core utilization as a percentage of the GPUs allocated (the requests.gpu parameter).
Execution Logs (Preview)#

This tab is a preview feature that displays the stdout (the standard output) of the container running the task.
Currently, it only shows content while the task is actually running.
Map Tasks#
When the task you want to monitor is a map task, accessing the utilization data is a bit different. Here is the task execution view of map task. Open the drop-down to reveal each subtask within the map task:

Drill down by clicking on one of the subtasks:

This will bring you to the individual subtask information panel, where the View Utilization button for the subtask can be found:

Clicking on View Utilization will take you to the task-level monitoring page for the subtask, which will have the same structure and features as the task-level monitoring page for a standard task (see above).