Time Series Model Comparison#
This tutorial demonstrates how to set up a simple workflow to visually compare various time series forecasting methods. We will make use of Flyte Decks to visually compare the results of the forecasters in the Union console. We will also produce traceable lineage for all the data we produce using Artifacts.
Run on Union Serverless
Once you have a Union account, install union:
pip install union
Then run the following commands to run the workflow:
git clone https://github.com/unionai/unionai-examples
cd unionai-examples/tutorials/time_series_forecasting
union run --remote --copy-all workflows/time_series_workflow.py time_series_workflow --steps 5
The source code for this tutorial can be found here .
Overview#
For demonstration purposes, we will produce some dummy data and select three arbitrary
forecasting models: SARIMA using statsmodels,
Prophet, and an LSTM using pytorch. Each of these
models require their own dependencies which we will control using container images
defined using ImageSpec.
To start we import the non-model-specific dependencies that are included in any Union base image by default:
import os
from datetime import datetime, timedelta
from typing import Annotated, List, Tuple
import numpy as np
import pandas as pd
from flytekit import task, workflow, ImageSpec, dynamic, Deck
from flytekit.core.artifact import Artifact, Granularity
from flytekit.deck import MarkdownRenderer
from union.artifacts import ModelCard
We will also define some artifacts
that we use to track the lineage of both the training data and the forecasts.
Later on, we use these artifacts as inputs in other workflows or use
them to trigger other LaunchPlans.
The TrainingData artifact will represent the training data passed into the model.
We will set a time partition to TrainingData that indicates the day following the end
of the data. Time partitions allow for time related metadata to be attached to artifacts,
enabling better organization and querying capabilities.
The TimeSeriesForecast artifact will represent the forecast data from a time series model.
A model partition is added representing the model used to create an instance
of the TimeSeriesForecast artifact.
To give further visibility into the data used in the artifacts, we define a generate_card
function that will compile our timeseries data into markdown for easy readability in the Union console.
TrainingData = Artifact(
    name="time-series-data",
    time_partitioned=True,
    time_partition_granularity=Granularity.DAY,
)
TimeSeriesForecast = Artifact(name="time-series-forecast", partition_keys=["model"])
def generate_card(df: pd.DataFrame) -> str:
    contents = "# Dataset Card\n"
    contents = contents + df.to_markdown()
    return contents
Retrieving Time Series Data#
For demonstration purposes, we simply generate some cyclic data from a sine wave with random noise.
We include pandas as a single dependency in an ImageSpec, and our TrainingData is Annotated
in the output signature of the task as well as returned using the time_partition and create_from
method of the artifact.
@task(
    container_image=ImageSpec(
        registry=os.environ.get("IMAGE_SPEC_REGISTRY"), packages=["pandas==2.2.2"]
    )
)
def get_data(steps: int) -> Tuple[datetime.date, Annotated[List[float], TrainingData]]:
    """Dummy task to generate some sample time series data.

    :param int steps: Number of days we want to forecast.
    :return: Start date of the forecast (day following the last day of historical data)
    and historical timeseries data.
    """
    start_date = datetime(2024, 1, 3).date()
    # We use five times as many historical days as the days we want to eventually
    # forecast.
    days_of_data = steps * 5
    noise_level = 0.2
    noise = np.random.normal(0, noise_level, days_of_data)
    data = np.sin(np.linspace(0, 20, days_of_data)) + noise

    return start_date, TrainingData.create_from(
        [float(x) for x in data],
        time_partition=datetime.combine(start_date, datetime.min.time()),
    )
Generating Forecasts#
To generate forecasts, we will make standard interface from which we can call our SARIMA, Prophet, and LSTM models. The interface as well as the forecasters themselves can be defined in their own directory using the following structure:
├── forecasters
│     ├── __init__.py
│     ├── forecaster.py
│     ├── lstm_forecaster.py
│     ├── prophet_forecaster.py
│     └── sarima_forecaster.py
└── workflows
    ├── __init__.py
    └── time_series_workflow.py
We can then use an ImageSpec to include any forecaster specific dependencies that are imported
in the forecaster’s respective python module. Similar to the get_data task above, TrainingData
is Annotated in the output signature of the task as well as returned with a model partition.
We also query for the TrainingData artifact to pass as input to the forecasting tasks.
@task(
    container_image=ImageSpec(
        registry=os.environ.get("IMAGE_SPEC_REGISTRY"),
        packages=["pandas==2.2.2", "statsmodels==0.14.2", "tabulate==0.9.0"],
    )
)
def sarima_forecast(
    start_date: datetime.date, steps: int, data: List[float] = TrainingData.query()
) -> Annotated[pd.DataFrame, TimeSeriesForecast]:
    """Import and call the SARIMA Forecaster

    :param datetime.date start_date: Start date of the forecast (day following the last
    day of historical data).
    :param int steps: Number of days we want to forecast.
    :param List[float] data: Historical time series data.
    :return: DataFrame containing the time series forecast with a datetime index.
    """
    from forecasters.sarima_forecaster import SARIMAForecaster

    sarima_forecaster = SARIMAForecaster()
    forecast = sarima_forecaster.forecast(data, steps, start_date)
    return TimeSeriesForecast.create_from(
        forecast, ModelCard(generate_card(forecast)), model="sarima"
    )
@task(
    container_image=ImageSpec(
        registry=os.environ.get("IMAGE_SPEC_REGISTRY"),
        packages=["pandas==2.2.2", "prophet==1.1.5", "tabulate==0.9.0"],
    )
)
def prophet_forecast(
    start_date: datetime.date, steps: int, data: List[float] = TrainingData.query()
) -> Annotated[pd.DataFrame, TimeSeriesForecast]:
    """Import and call the Prophet Forecaster

    :param datetime.date start_date: Start date of the forecast (day following the last
    day of historical data).
    :param int steps: Number of days we want to forecast.
    :param List[float] data: Historical time series data.
    :return: DataFrame containing the time series forecast with a datetime index.
    """
    from forecasters.prophet_forecaster import ProphetForecaster

    prophet_forecaster = ProphetForecaster()
    forecast = prophet_forecaster.forecast(data, steps, start_date)
    return TimeSeriesForecast.create_from(
        forecast, ModelCard(generate_card(forecast)), model="prophet"
    )
@task(
    container_image=ImageSpec(
        registry=os.environ.get("IMAGE_SPEC_REGISTRY"),
        packages=["pandas==2.2.2", "torch==2.3.1", "tabulate==0.9.0"],
        pip_extra_index_url=["https://download.pytorch.org/whl/cpu"],
    )
)
def lstm_forecast(
    start_date: datetime.date, steps: int, data: List[float] = TrainingData.query()
) -> Annotated[pd.DataFrame, TimeSeriesForecast]:
    """Import and call the LSTM Forecaster

    :param datetime.date start_date: Start date of the forecast (day following the last
    day of historical data).
    :param int steps: Number of days we want to forecast.
    :param List[float] data: Historical time series data.
    :return: DataFrame containing the time series forecast with a datetime index.
    """
    from forecasters.lstm_forecaster import LSTMForecaster

    lstm_forecaster = LSTMForecaster()
    forecast = lstm_forecaster.forecast(data, steps, start_date)
    return TimeSeriesForecast.create_from(
        forecast, ModelCard(generate_card(forecast)), model="lstm"
    )
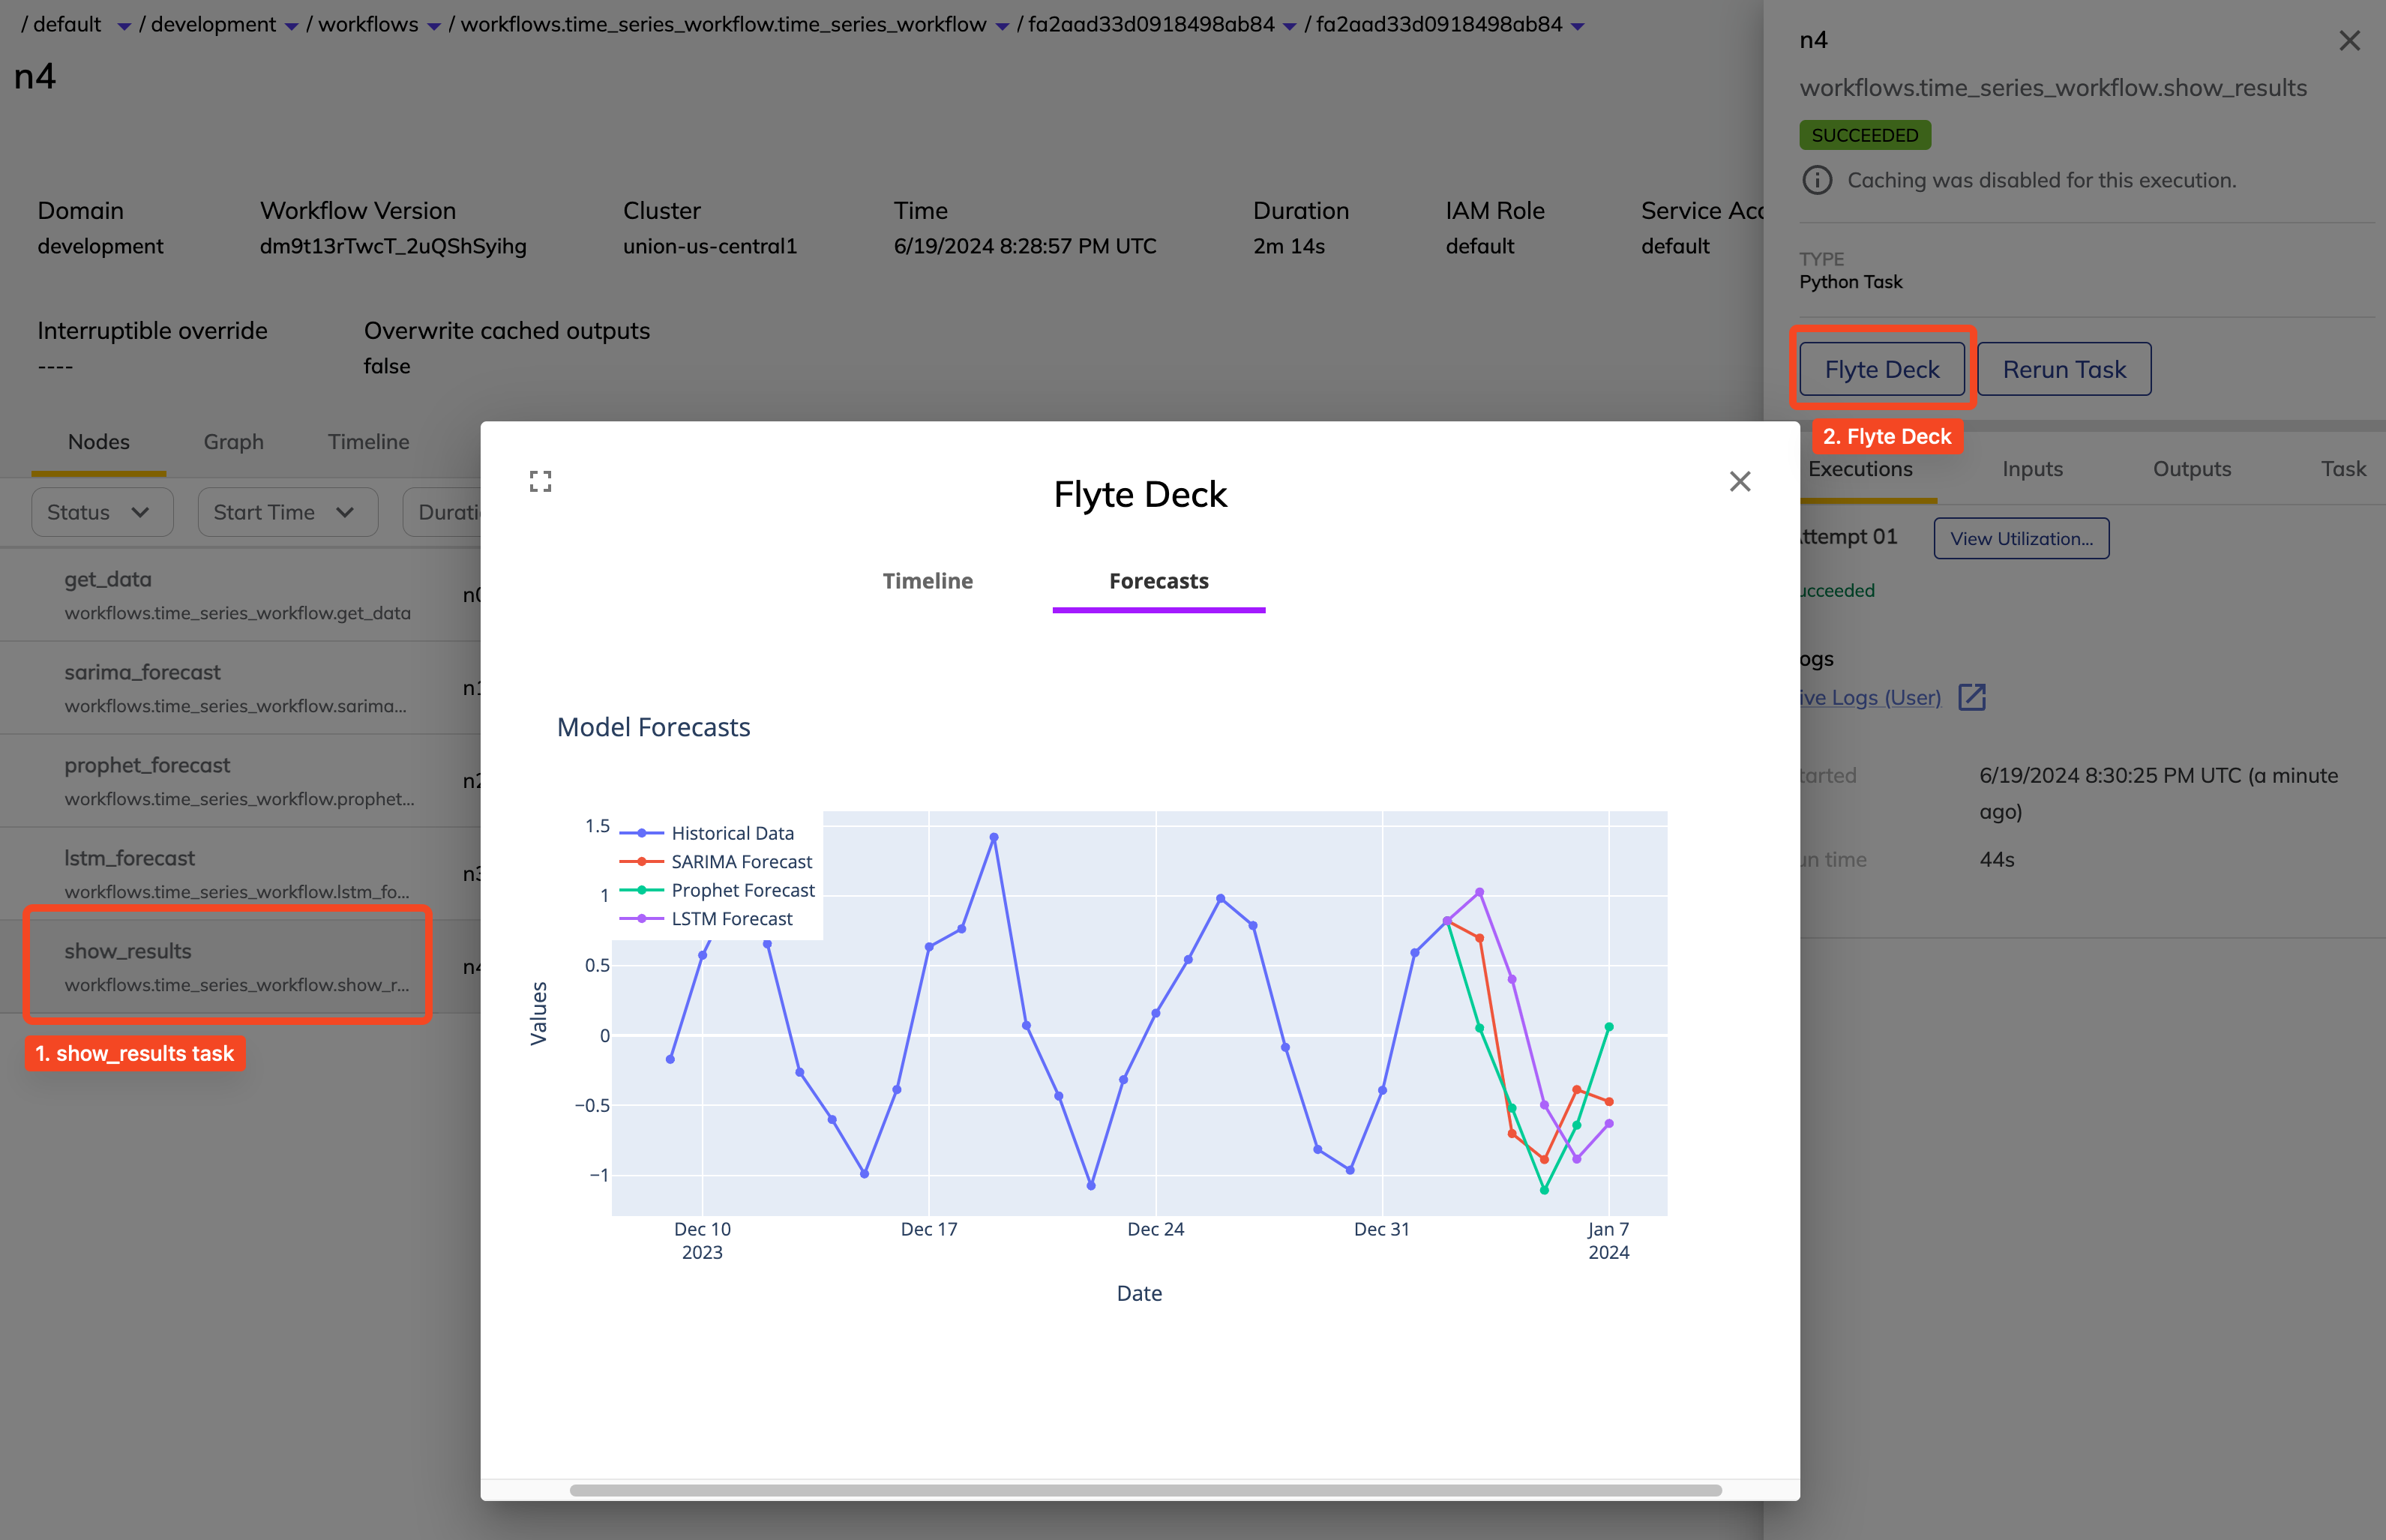
Visualizing the results#
Aggregating the forecasts from each forecaster, we display them in a plot rendered to html
using plotly. This plot is included in a Deck which is visible in the Union console.
@dynamic(
    enable_deck=True,
    container_image=ImageSpec(
        registry=os.environ.get("IMAGE_SPEC_REGISTRY"),
        packages=["pandas==2.2.2", "plotly==5.22.0"],
    ),
)
def show_results(
    start_date: datetime.date,
    preds: List[pd.DataFrame],
    historical_data: List[float] = TrainingData.query(),
):
    """Create a Flyte Deck showing the historical data and comparing the various forecasts.

    :param datetime.date start_date: Start date of the forecast (day following the last
    day of historical data).
    :param pd.DataFrame preds: List of DataFrames where each contains a forecast from one
    of the forecasters.
    :param List[float] historical_data: Historical time series data.
    """
    import plotly

    # Create the historical dataframe
    hist_dates = pd.date_range(
        start=start_date - timedelta(days=len(historical_data)),
        periods=len(historical_data),
    )
    hist_df = pd.DataFrame({"datetime": hist_dates, "Historical": historical_data})

    # Append the last historical data point to each forecast dataframe for clean plotting
    last_hist_point = hist_df.iloc[-1]
    for df in preds:
        last_point = {
            "datetime": last_hist_point["datetime"],
            df.columns[1]: last_hist_point["Historical"],
        }
        df.loc[-1] = last_point
        df.index = df.index + 1
        df.sort_index(inplace=True)

    # Combine the dataframes on the 'datetime' column
    forecast_df = preds[0]
    for df in preds[1:]:
        forecast_df = forecast_df.merge(df, on="datetime")

    # Create traces for historical data and forecasts
    traces = [
        plotly.graph_objs.Scatter(
            x=hist_df["datetime"],
            y=hist_df["Historical"],
            mode="lines+markers",
            name="Historical Data",
        )
    ]
    for column in forecast_df.columns:
        if column != "datetime":
            traces.append(
                plotly.graph_objs.Scatter(
                    x=forecast_df["datetime"],
                    y=forecast_df[column],
                    mode="lines+markers",
                    name=f"{column} Forecast",
                )
            )

    # Create the figure
    layout = plotly.graph_objs.Layout(
        title="Model Forecasts",
        xaxis=dict(title="Date"),
        yaxis=dict(title="Values"),
        legend=dict(x=0, y=1),
    )
    fig = plotly.graph_objs.Figure(data=traces, layout=layout)

    main_deck = Deck("Forecasts", MarkdownRenderer().to_html(""))
    main_deck.append(plotly.io.to_html(fig))
Creating the Workflow#
Our data retrieval, forecasting, and displaying tasks can be added to a workflow as shown
below. Since sarima_forecast, prophet_forecast, and lstm_forecast are all dependent
on get_data but not one another, they will run in parallel. Once the output from each
forecaster is available, show_results will run and produce the Deck for visualization.
@workflow
def time_series_workflow(steps: int = 5):
    """Workflow that creates historical data and visually compares three forecasting
    methods.

    :param str steps: Number of days to forecast in the future.
    """
    start_date, data = get_data(steps=steps)

    sarima_pred = sarima_forecast(start_date=start_date, steps=steps, data=data)
    prophet_pred = prophet_forecast(start_date=start_date, steps=steps, data=data)
    lstm_pred = lstm_forecast(start_date=start_date, steps=steps, data=data)

    show_results(
        start_date=start_date,
        historical_data=data,
        preds=[sarima_pred, prophet_pred, lstm_pred],
    )
Since the workflow depends on forecasters defined in different python modules, we either
run the workflow from the parent time_series_forecasting directory using --copy-all
to include all related modules in the run:
union run --remote --copy-all workflows/time_series_workflow.py time_series_workflow --steps 5
Or we register the parent directory like so:
union register time_series_forecasting/
and trigger the workflow either though the Union console or using UnionRemote.