Viewing workflow executions#
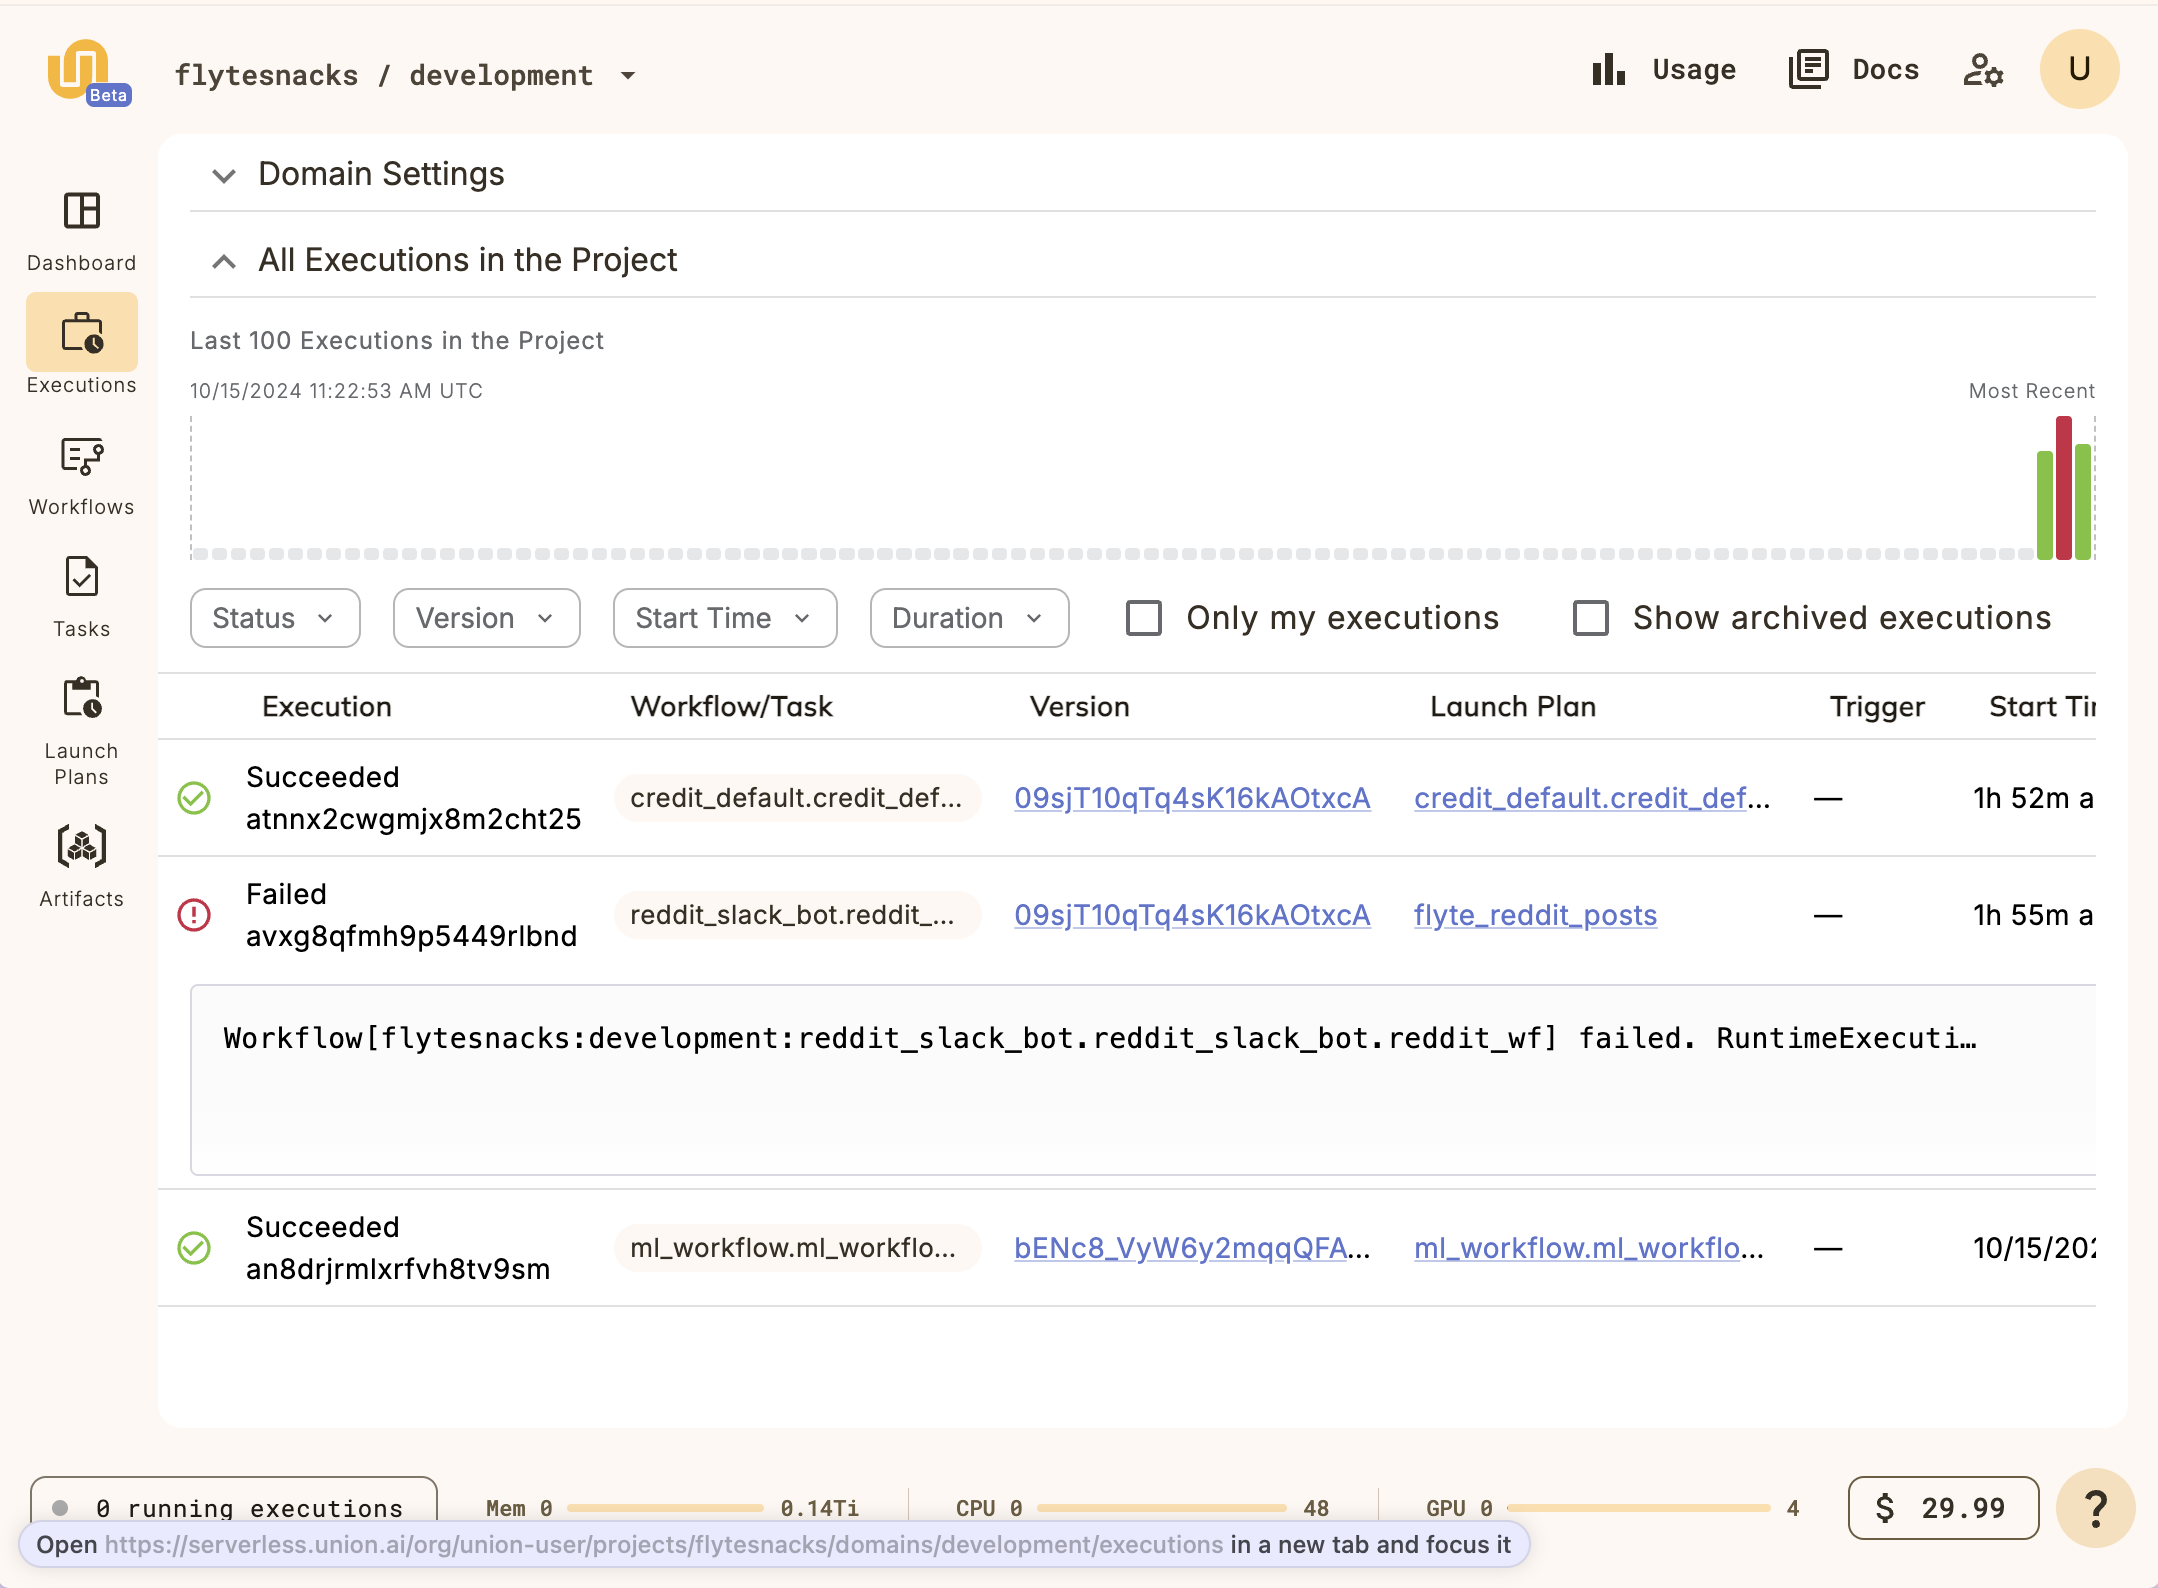
The Executions list shows all executions in a project and domain combination. An execution represents a single run of all or part of a workflow (including subworkflows and individual tasks). You can access it from the Executions link in the left navigation.
Domain Settings#
This section displays any domain-level settings that have been configured for this project-domain combination. They are:
Security Context
Labels
Annotations
Raw output data config
Max parallelism
All Executions in the Project#
For each execution in this project and domain you can see the following:
A graph of the last 100 executions in the project.
Start time: Select to view the individual execution.
Workflow/Task: The individual workflow or individual task that ran in this execution.
Version: The version of the workflow or task that ran in this execution.
Launch Plan: The Launch Plan that was used to launch this execution.
Schedule: The schedule that was used to launch this execution (if any).
Execution ID: The ID of the execution.
Status: The status of the execution. One of QUEUED, RUNNING, SUCCEEDED, FAILED or UNKNOWN.
Duration: The duration of the execution.
Execution view#
The execution view appears when you launch a workflow or task or select an already completed execution.
An execution represents a single run of all or part of a workflow (including subworkflows and individual tasks).
Note
An execution usually represents the run of an entire workflow. But, because workflows are composed of tasks (and sometimes subworkflows) and Union caches the outputs of those independently of the workflows in which they participate, it sometimes makes sense to execute a task or subworkflow independently.
The top part of execution view provides detailed general information about the execution.
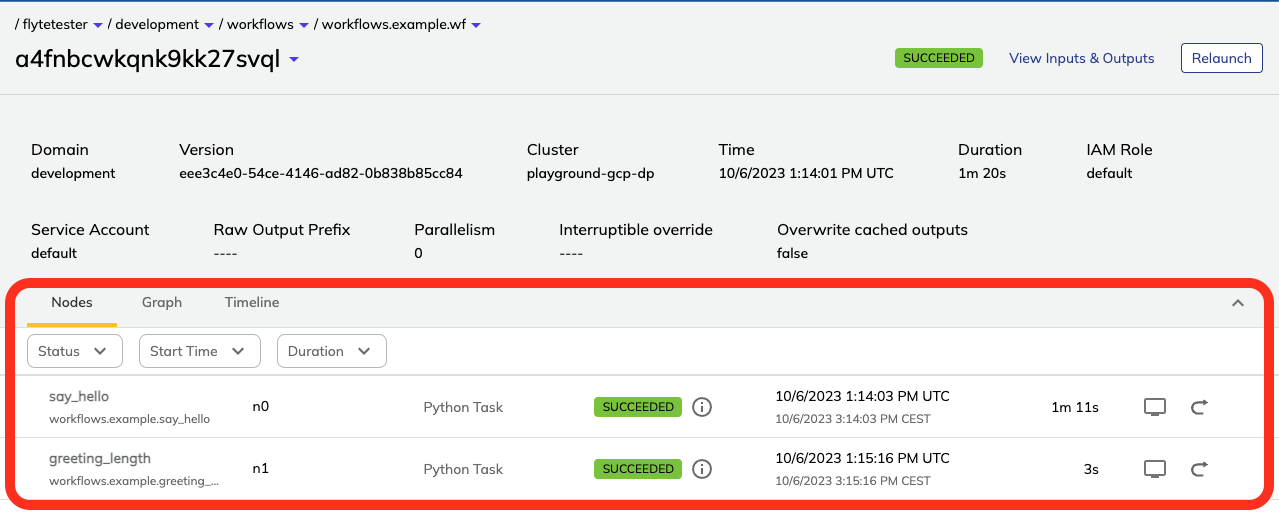
The bottom part provides three tabs displaying different aspects of the execution: Nodes, Graph, and Timeline.
Nodes#
The default tab within the execution view is the Nodes tab. It shows a list of the Flyte nodes that make up this execution (A node in Flyte is either a task or a (sub-)workflow).
Selecting an item in the list opens the right panel showing more details of that specific node:
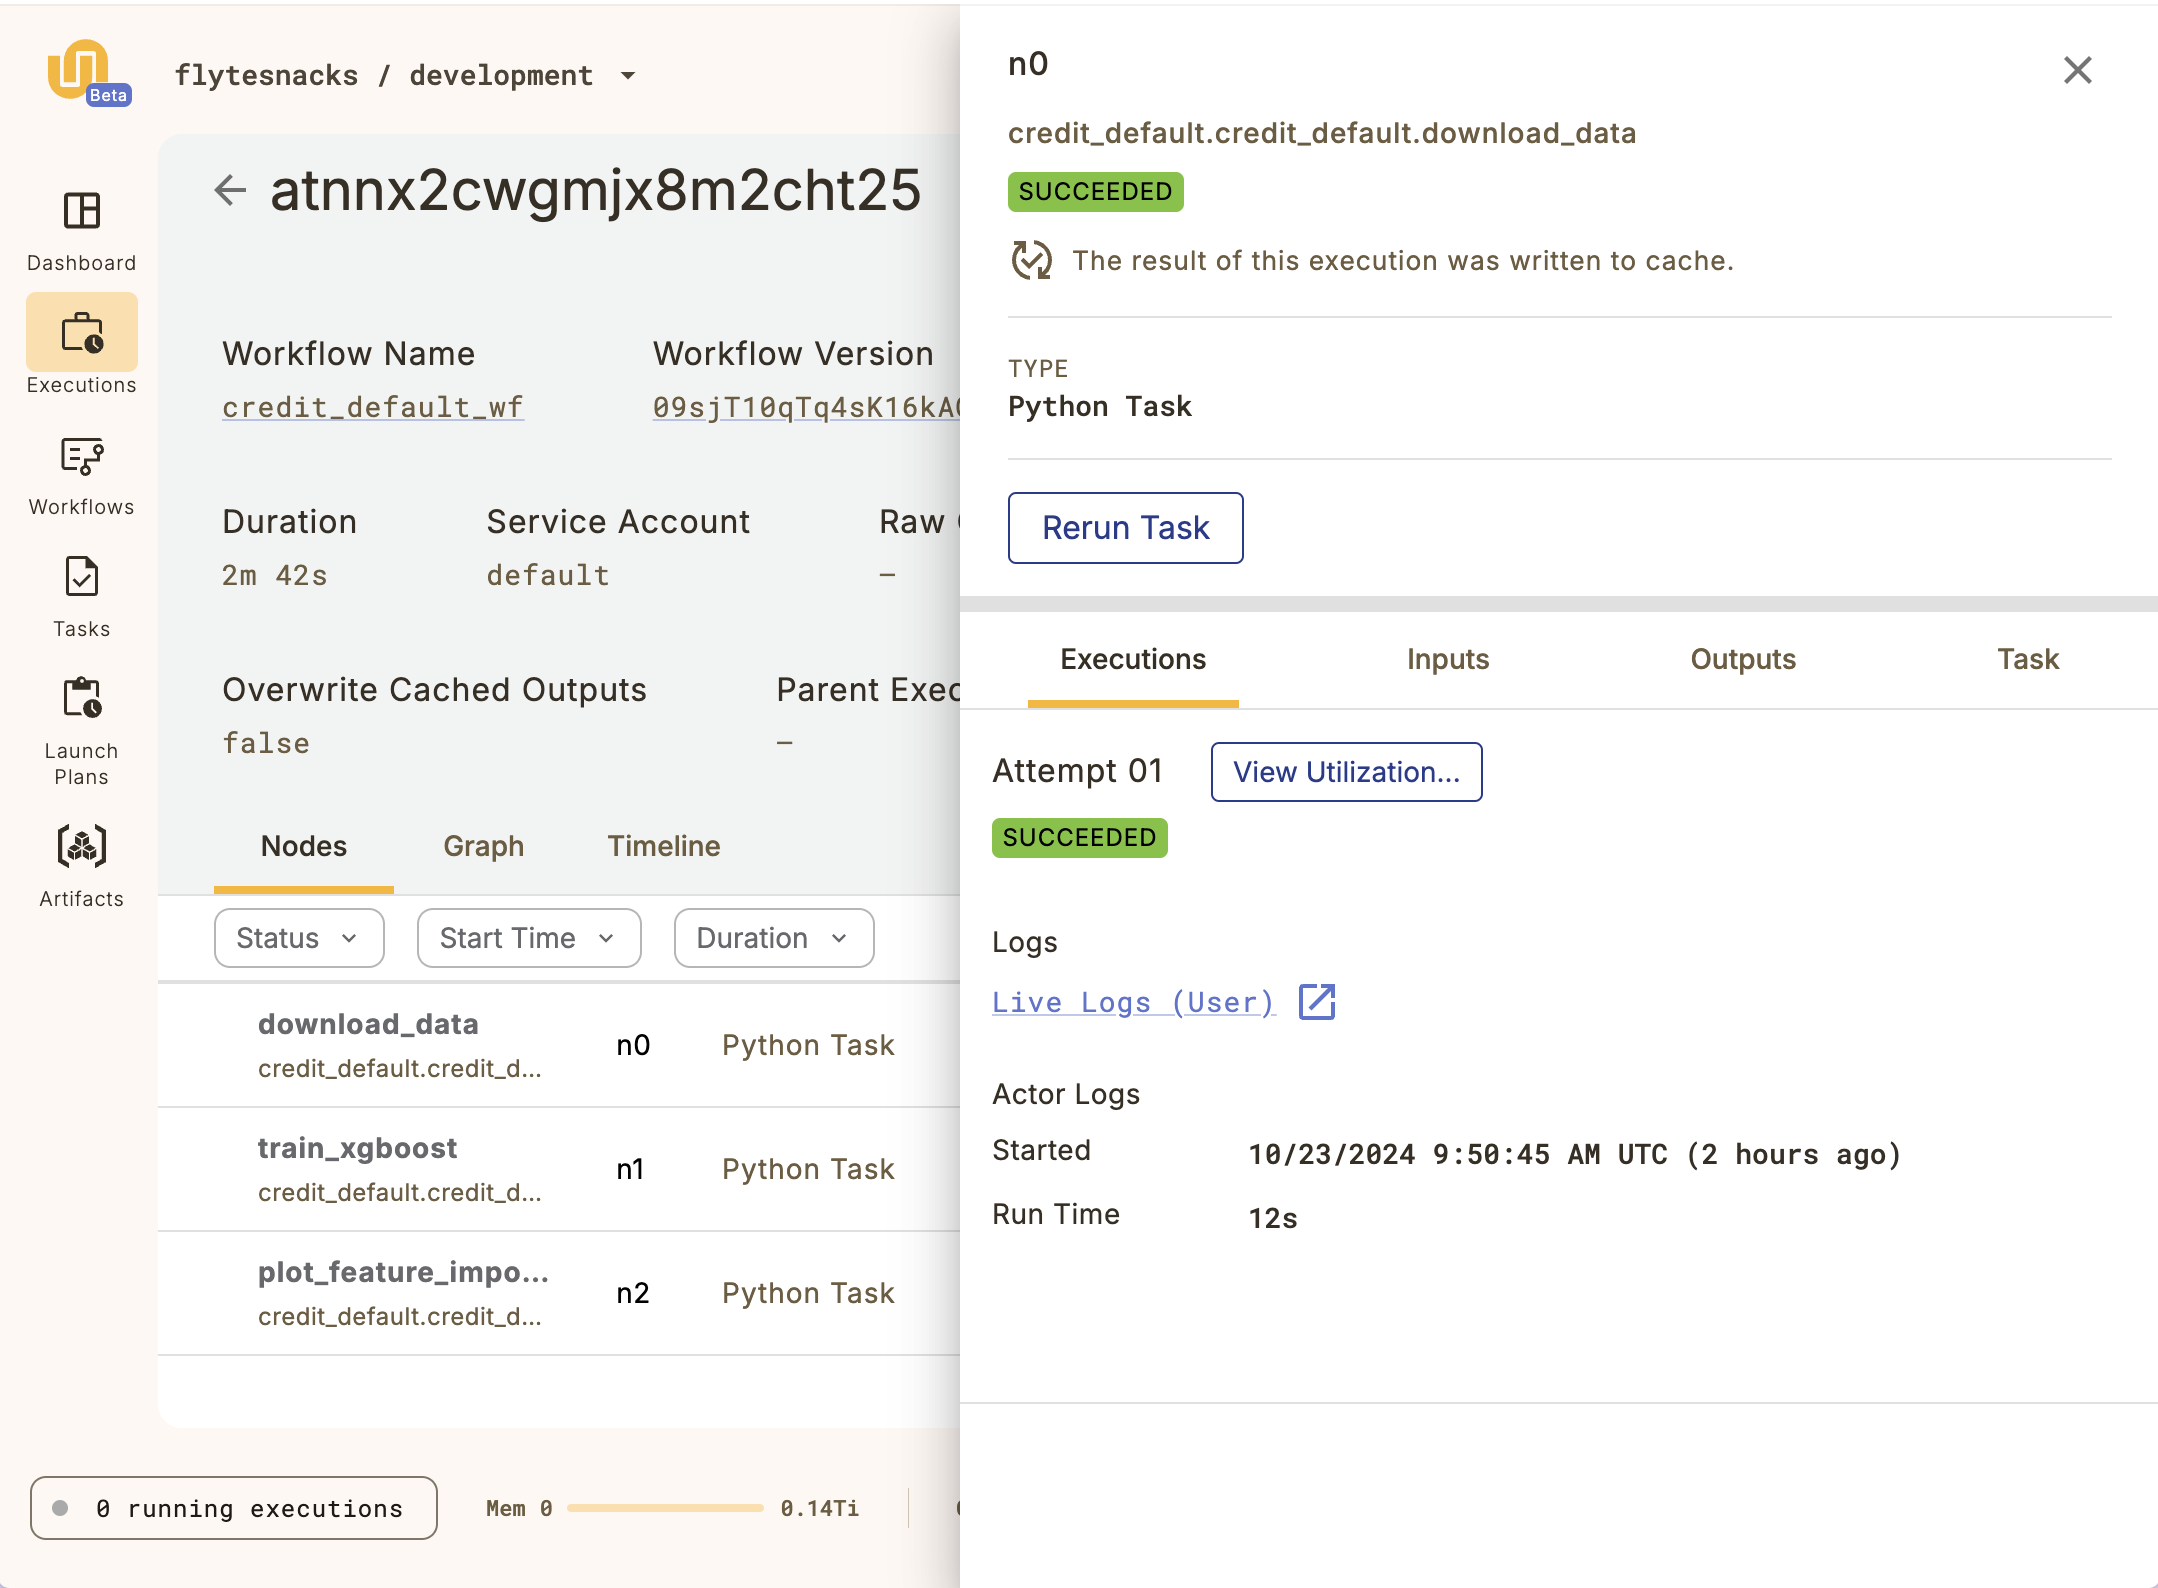
The top part of the side panel provides detailed information about the node as well as the Rerun task button.
Below that, you have the following tabs: Executions, Inputs, Outputs, and Task.
The Executions tab gives you details on the execution of this particular node as well as access to:
Task level monitoring: You can access the task-level monitoring information by selecting View Utilization.
Logs: You can access logs by clicking the text under Logs. See Logging.
The Inputs, Outputs tabs display the data that was passed into and out of the node, respectively.
If this node is a task (as opposed to a subworkflow) then the Task tab displays the Task definition structure.
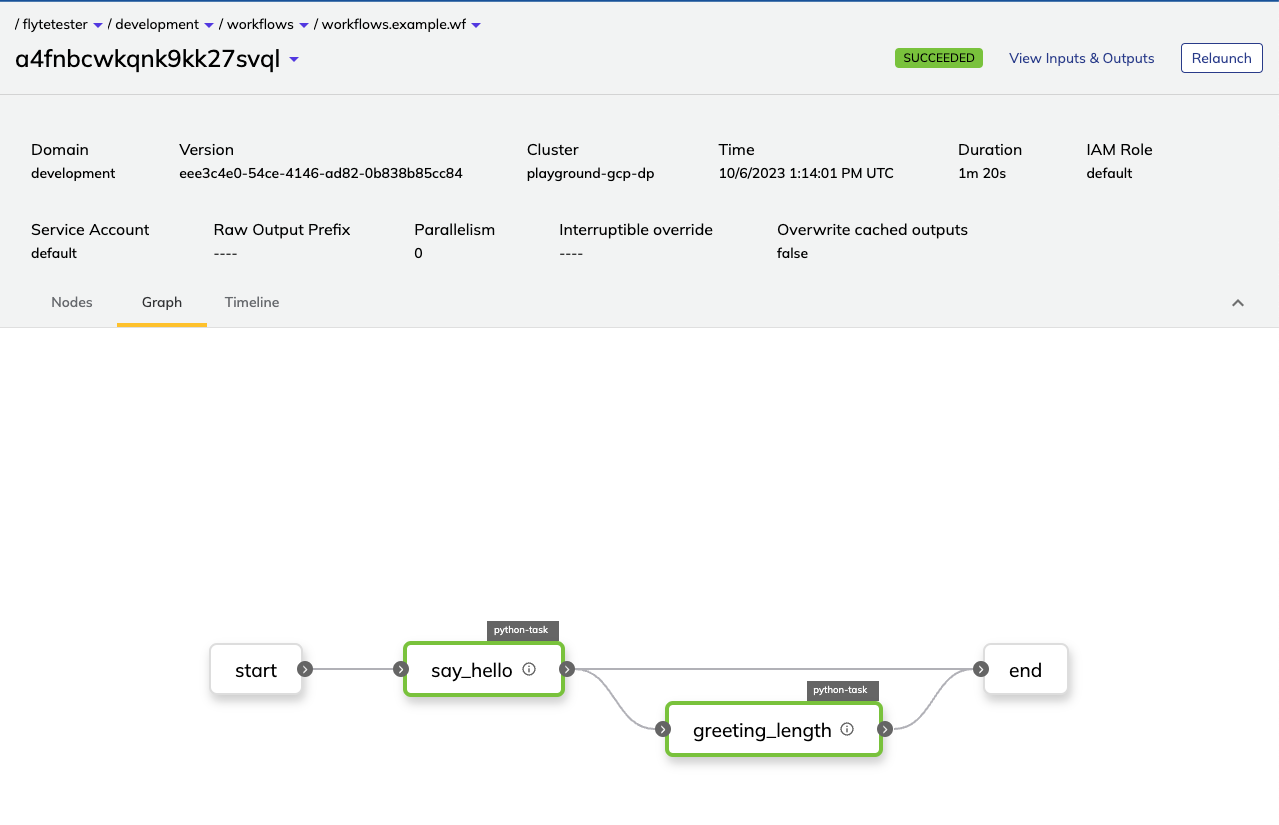
Graph#
The Graph tab displays a visual representation of the execution as a directed acyclic graph:
Timeline#
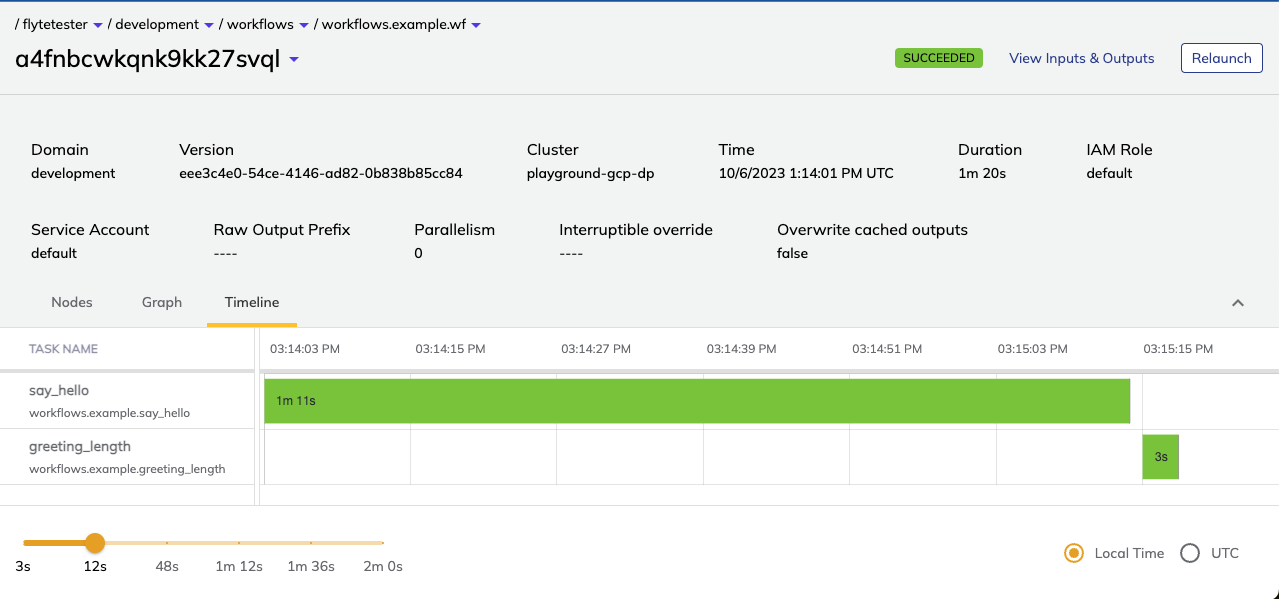
The Timeline tab displays a visualization showing the timing of each task in the execution:
