Running in a local cluster#
Running in a local Kubernetes cluster#
Ultimately you will be running your workflows in a Kubernetes cluster in Union. But it can be handy to try out a workflow in a cluster on your local machine. Flyte enables this.
First, ensure that you have Docker (or a similar OCI-compliant container engine) installed locally and that the daemon is running.
Then start the demo cluster using uctl:
$ uctl demo start
Configuration#
When uctl starts the cluster in your local container engine it also writes configuration information to the directory ~/.uctl/.
Most importantly, it creates the file ~/.uctl/config-sandbox.yaml. This file holds (among other things) the location of the Kubernetes cluster to which we will be deploying the workflow:
admin:
  endpoint: localhost:30080
  authType: Pkce
  insecure: true
console:
  endpoint: http://localhost:30080
logger:
  show-source: true
  level: 0
Right now this file indicates that the target cluster is your local Docker instance (localhost:30080), but later we will change it to point to your Union cluster.
Later invocations of uctl or pyflyte will need to know the location of the target cluster. This can be provided in two ways:
Explicitly passing the location of the config file on the command line
uctl --config ~/.uctl/config-sandbox.yaml <command>pyflyte --config ~/.uctl/config-sandbox.yaml <command>
Setting the environment variable
FLYTECTL_CONFIGto the location of the config file:export FLYTECTL_CONFIG=~/.uctl/config-sandbox.yaml
Note
In this guide, we assume that you have set theFLYTECTL_CONFIG environment variable in your shell to the location of the configuration file.
Start the workflow#
Now you can run your workflow in the local cluster simply by adding the --remote flag to your pyflyte command:
[~/wine-classification]:wine-classification
$ pyflyte run --remote \
          workflows/example.py \
          training_workflow \
          --hyperparameters '{"C": 0.1}'
The output supplies a URL to your workflow execution in the Flyte console. It should look something like this:
Go to http://localhost:30080/console/projects/flytesnacks/domains/development/executions/f6ac3844ff43b4be69a9 to see execution in the console.
Inspect the results#
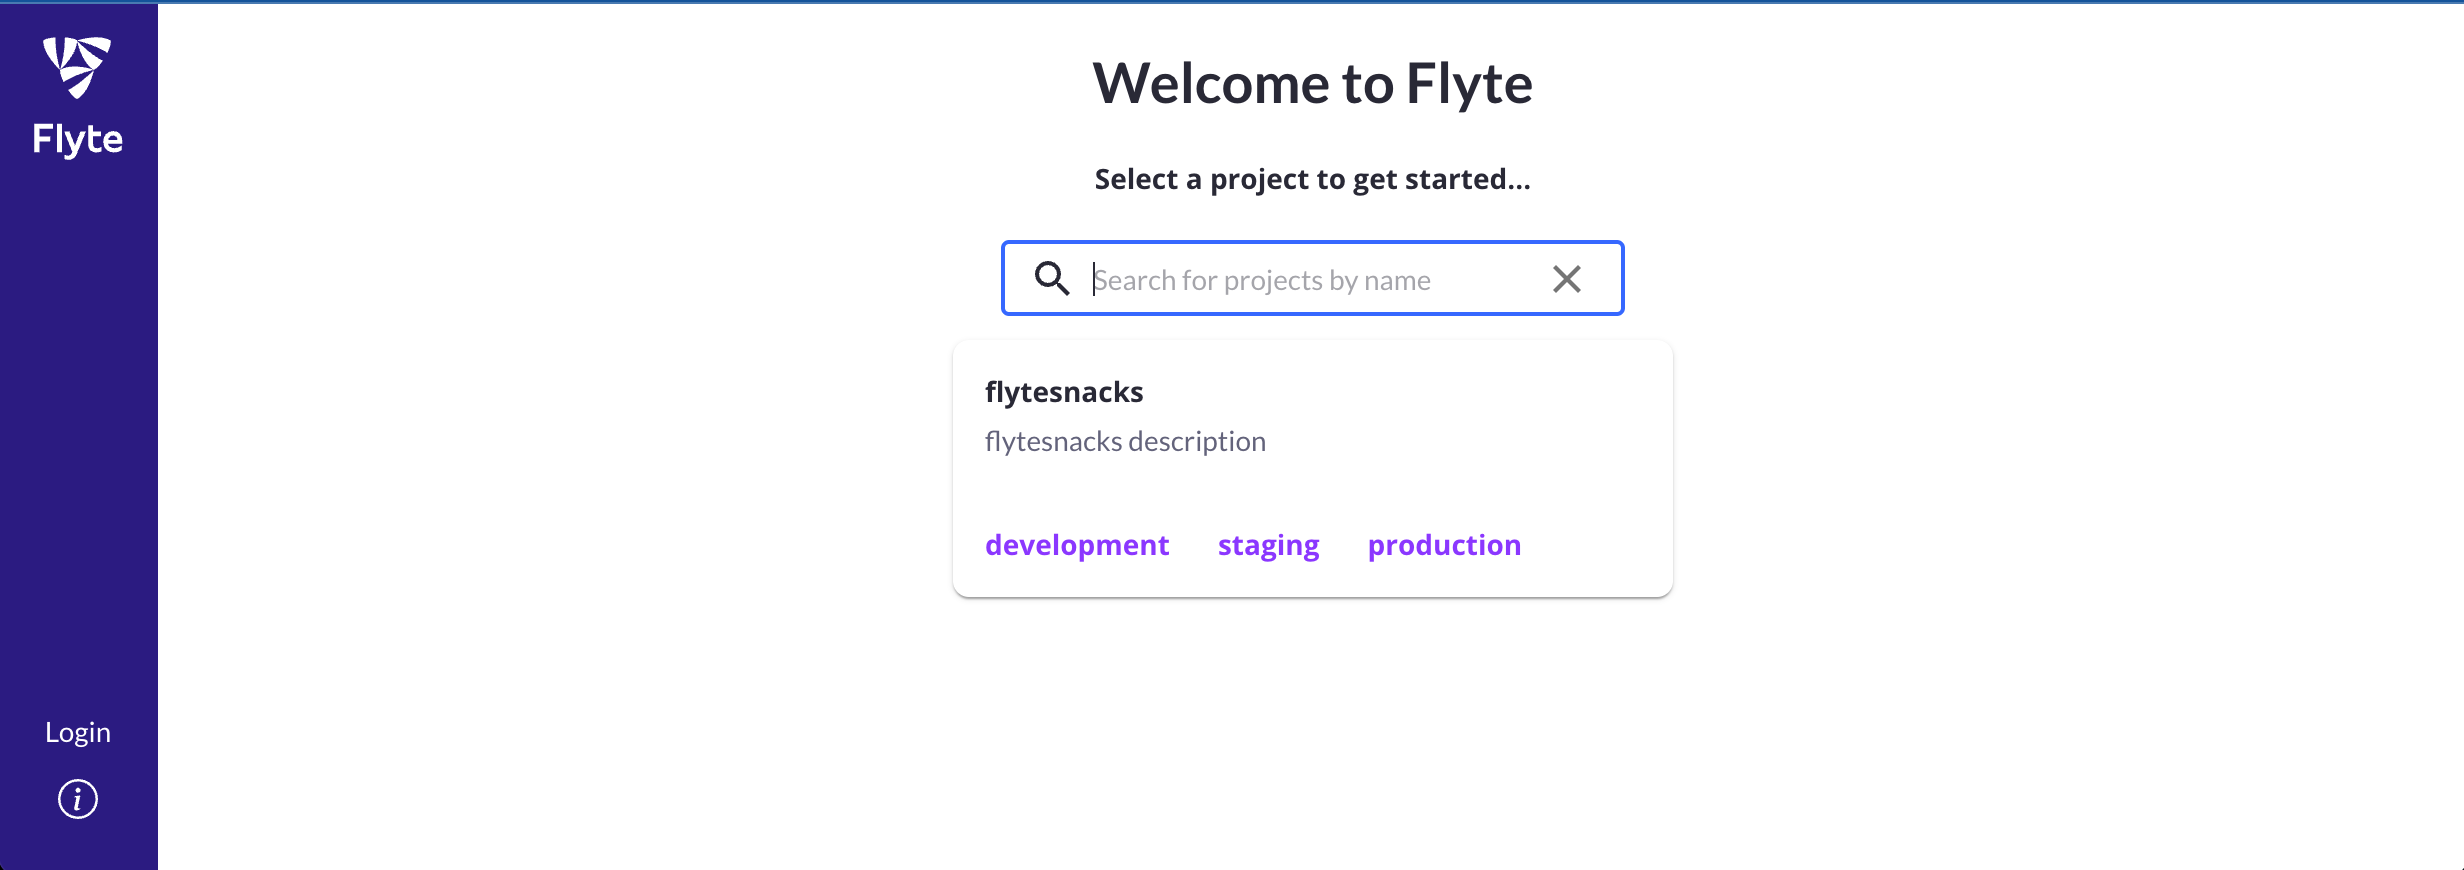
Navigate to the URL produced by pyflyte run. This will take you to the Flyte console, the web UI used to manage Flyte entities such as tasks, workflows, and executions:
There are a few features of the Flyte console worth pointing out:
The Nodes view shows the list of tasks executing in sequential order.
The right-hand panel shows metadata about the task execution, including logs, inputs, outputs, and task metadata.
The Graph view shows the execution graph of the workflow, providing visual information about the topology of the graph and the state of each node as the workflow progresses.
The Timeline view shows how long each part of the execution takes.
On completion, you can inspect the outputs of each task, and ultimately, that of the overarching workflow.