Viewing logs#
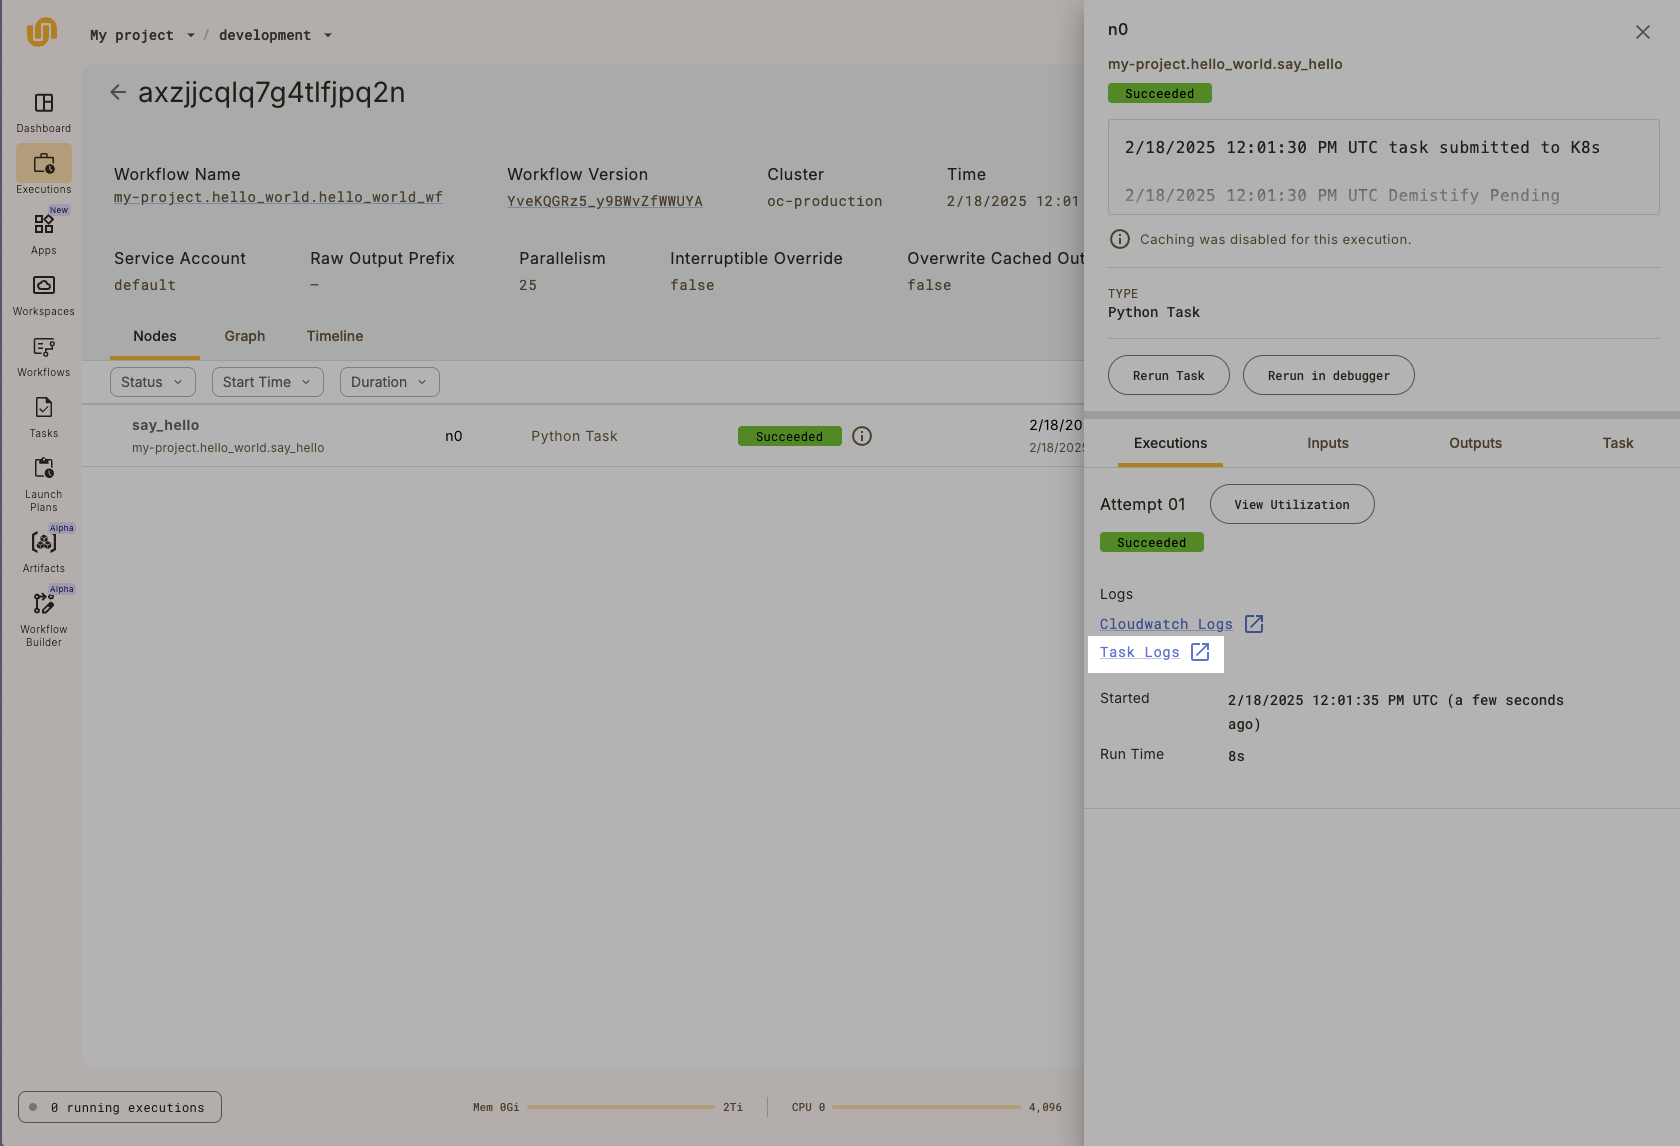
In the Execution view, selecting a task from the list in the Nodes tab will open the task details in the right panel.
Within that panel, in the Execution tab, under Logs, you will find a link labeled Task Logs.

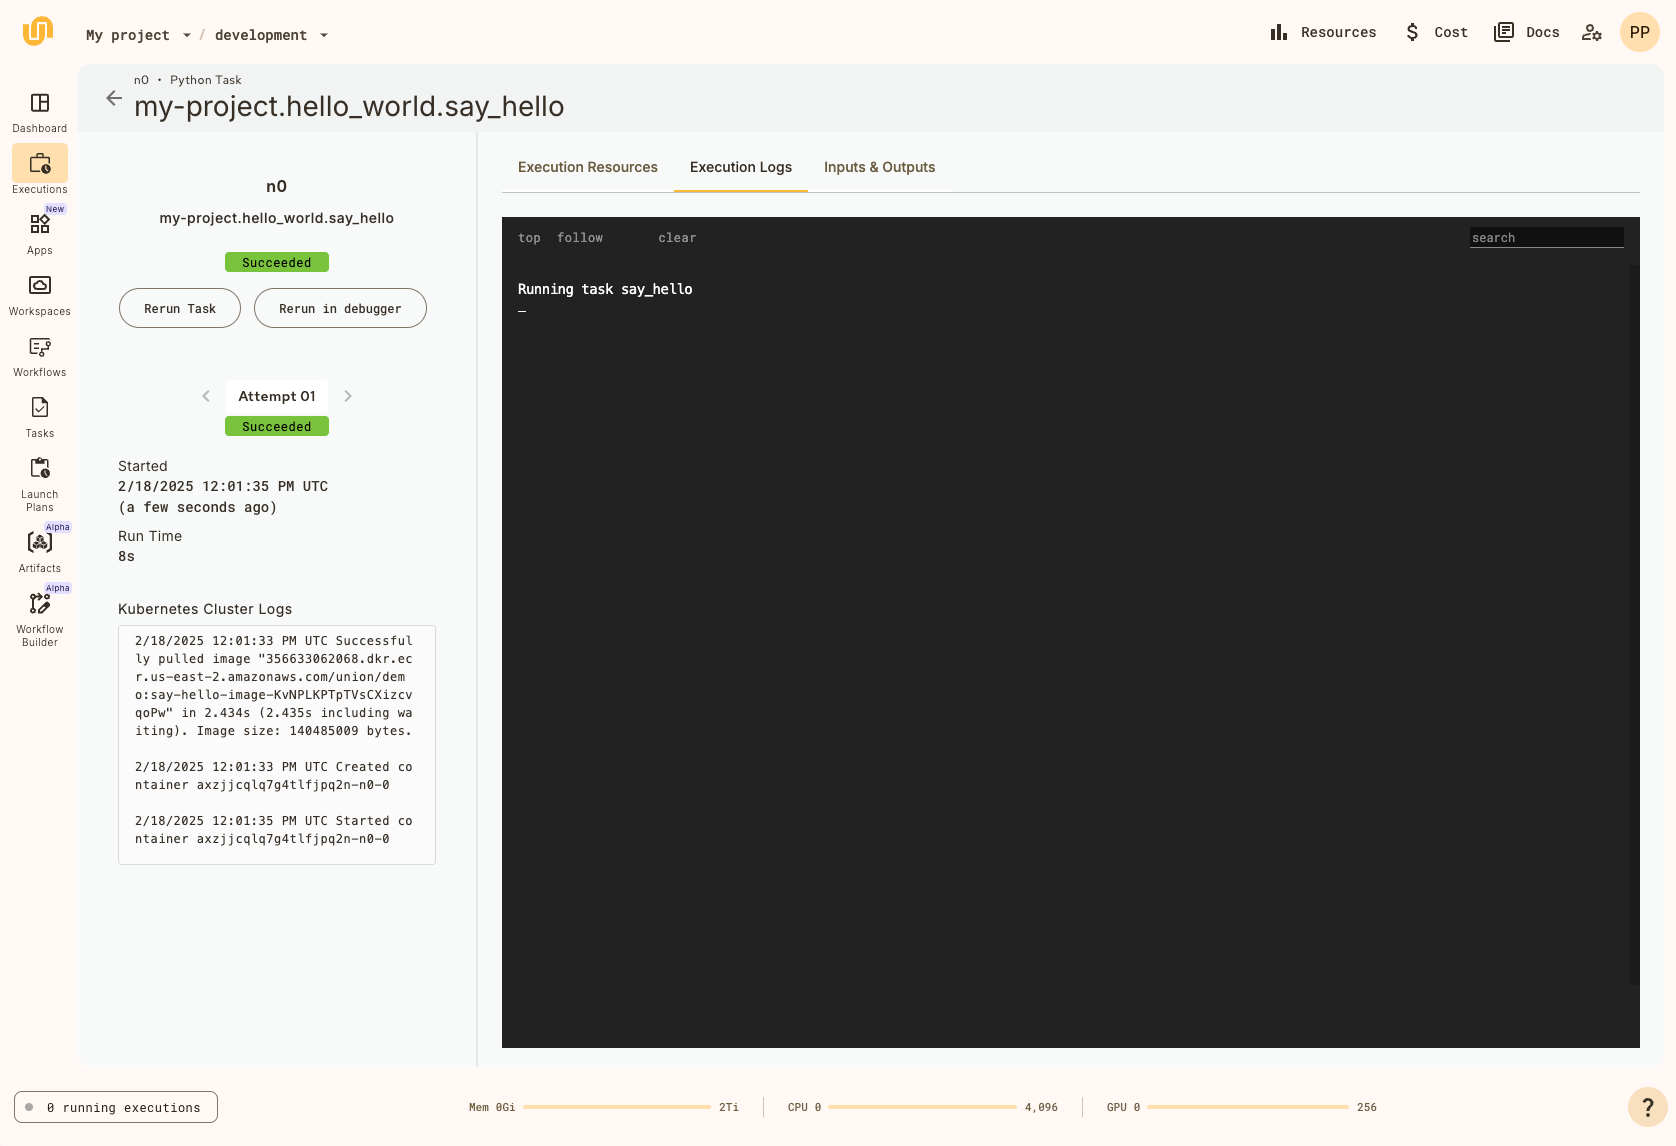
This leads to the Execution logs tab of the Execution details page:

The execution logs provide a live view into the standard output of the task execution.
For example, any print statements in the tasks Python code will be displayed here.
Kubernetes cluster logs#
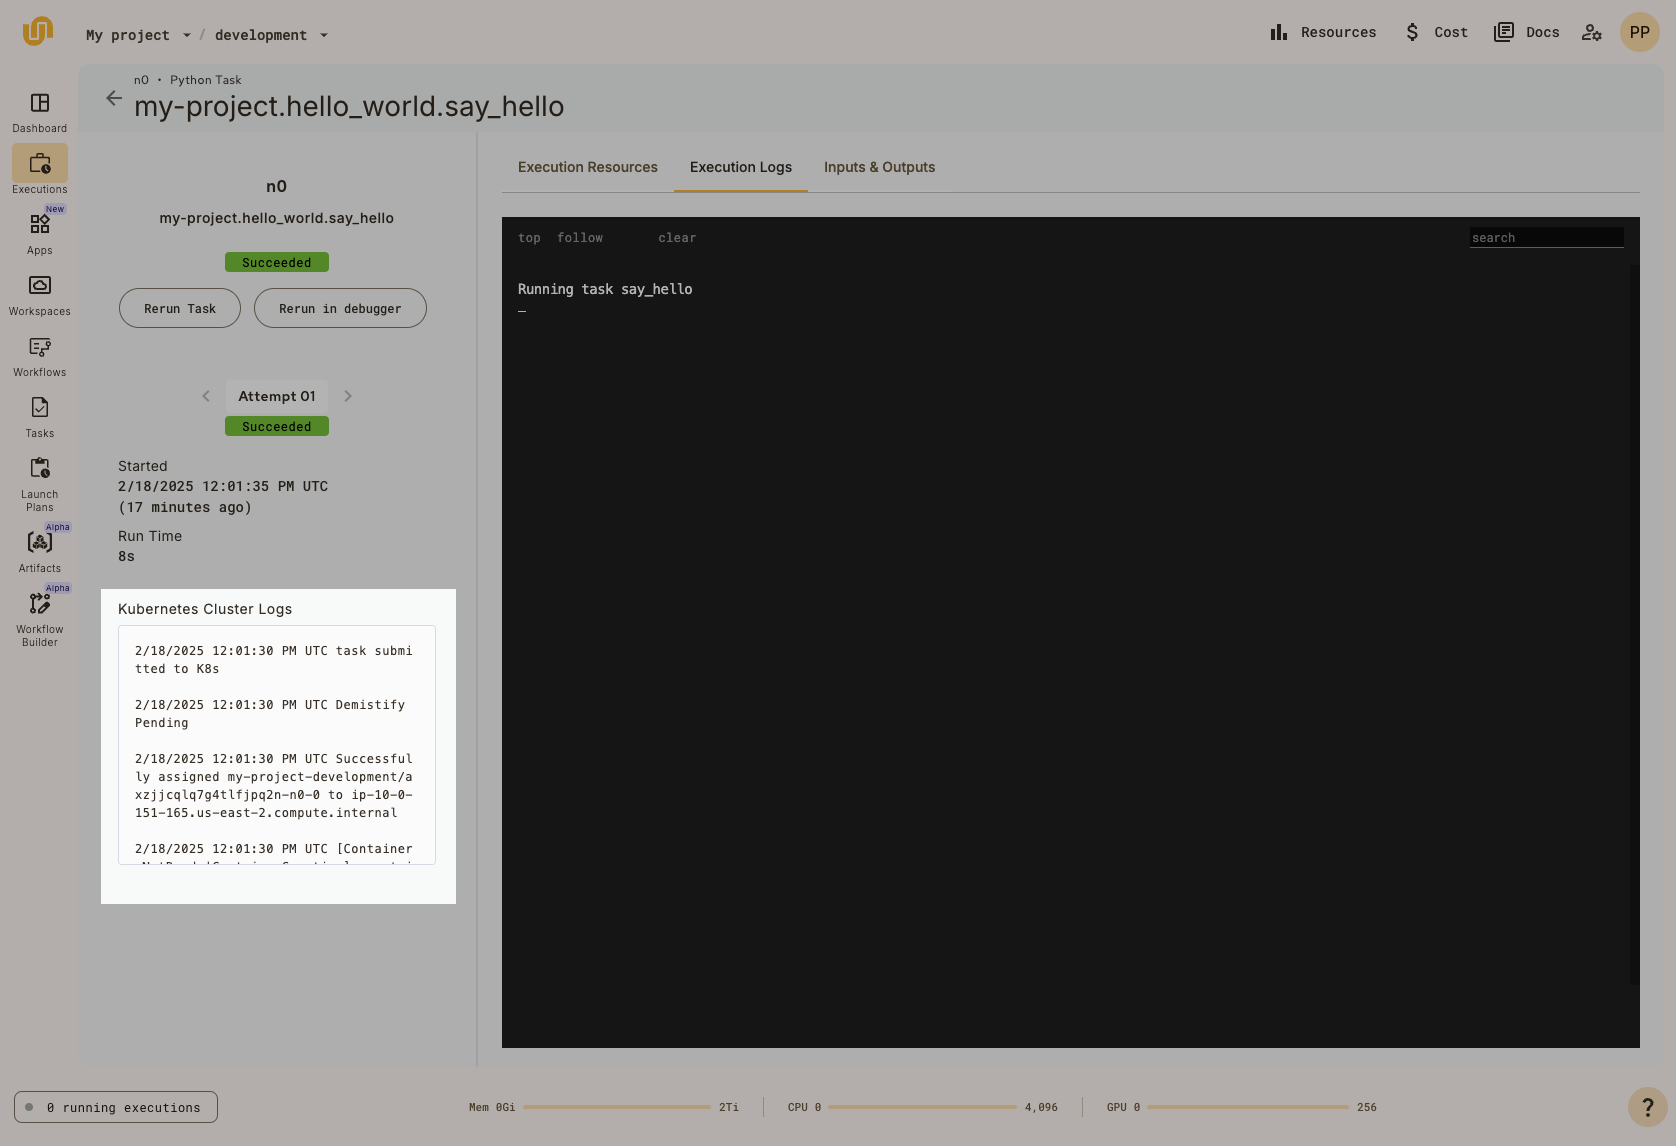
On the left side of the page you can also see the Kubernetes cluster logs for the task execution:

Other tabs#
Alongside the Execution logs tab in the Execution details page, you will also find the Execution resources and Inputs & Outputs tabs.
Cloud provider logs#
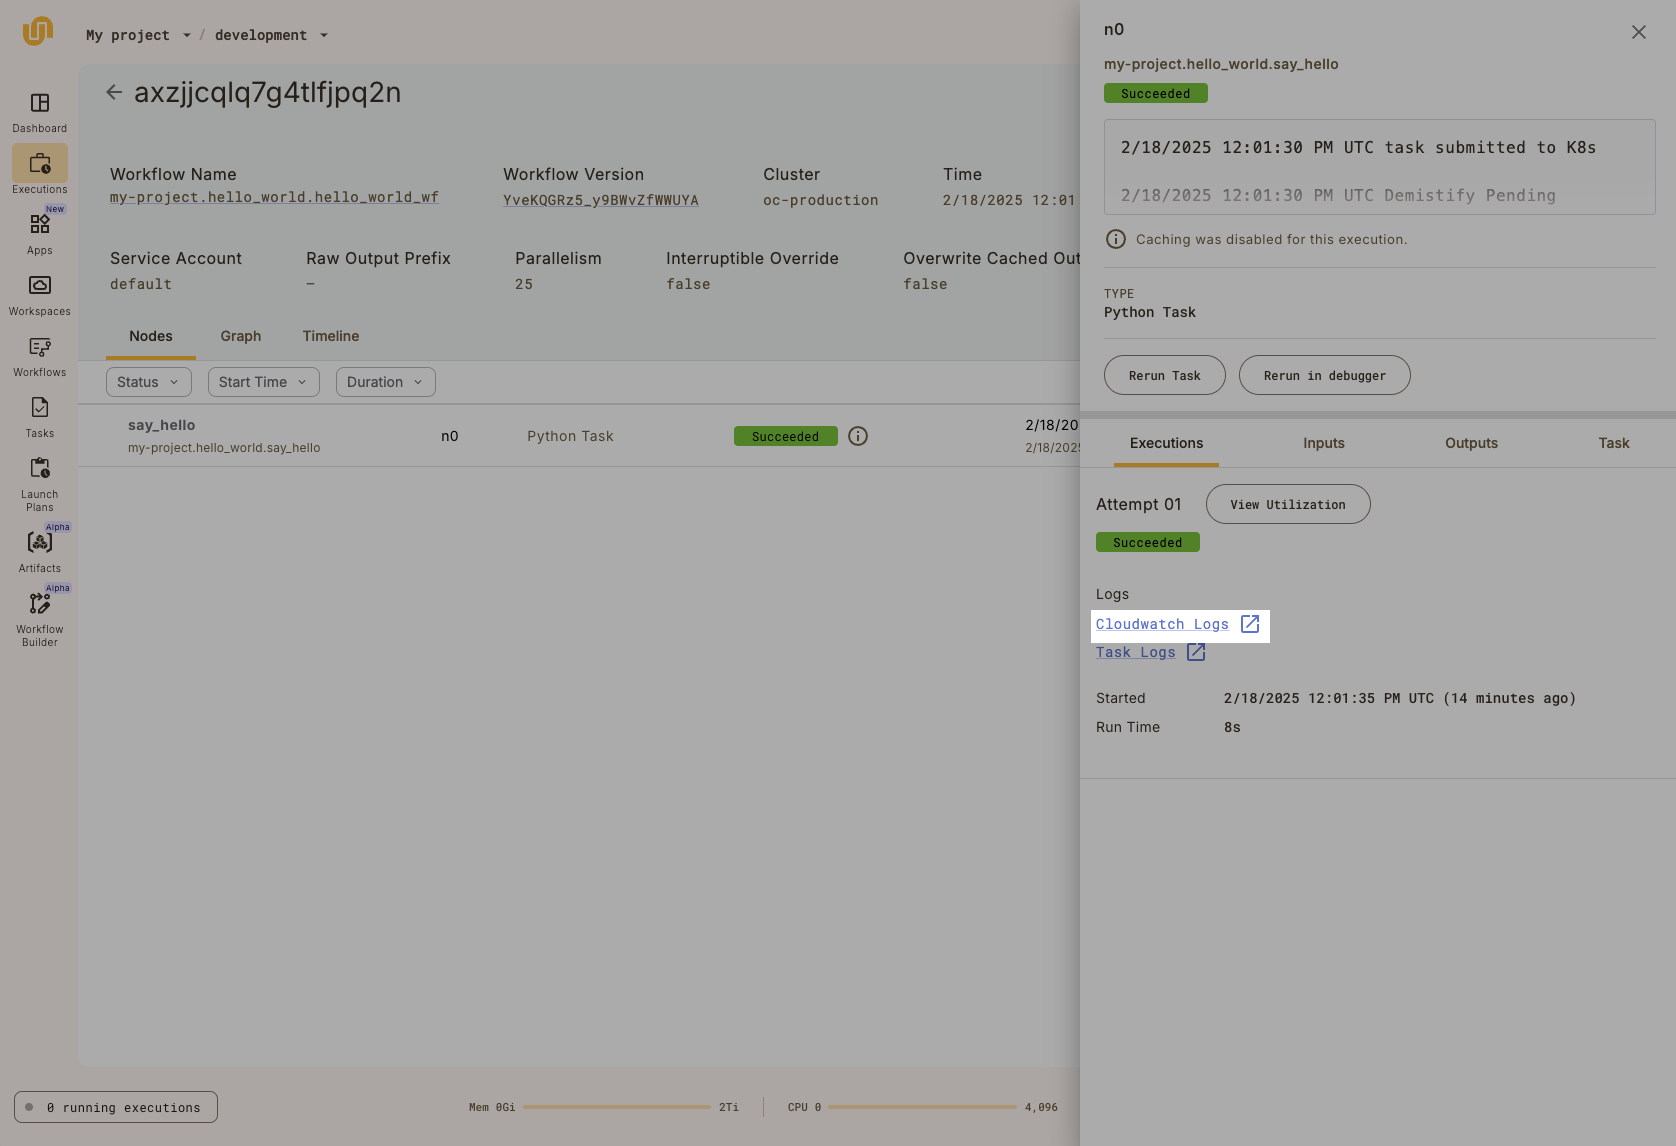
In addition to the Task Logs link, you will also see a link to your cloud provider’s logs (Cloudwatch Logs for AWS, Stackdriver Logs for GCP, and Azure Logs for Azure):

Assuming you are logged into your cloud provider account with the appropriate permissions, this link will take you to the logs specific to the container in which this particular task execution is running.