Resources#
Select Resources in the top right of the Union.ai interface to open a view showing the overall health and utilization of your Union.ai installation.

Four tabs are available: Executions, Resource Quotas, and Compute.
Executions#

This tab displays information about workflows, tasks, resource consumption, and resource utilization.
Filter#
The drop-downs at the top lets you filter the charts below by project, domain and time period:

Project: Dropdown with multi-select over all projects. Making a selection recalculates the charts accordingly. Defaults to All Projects.
Domain: Dropdown with multi-select over all domains (for example, development, staging, production). Making a selection recalculates the charts accordingly. Defaults to All Domains.
Time Period Selector: Dropdown to select the period over which the charts are plotted. Making a selection recalculates the charts accordingly. Defaults to 24 Hours. All times are expressed in UTC.
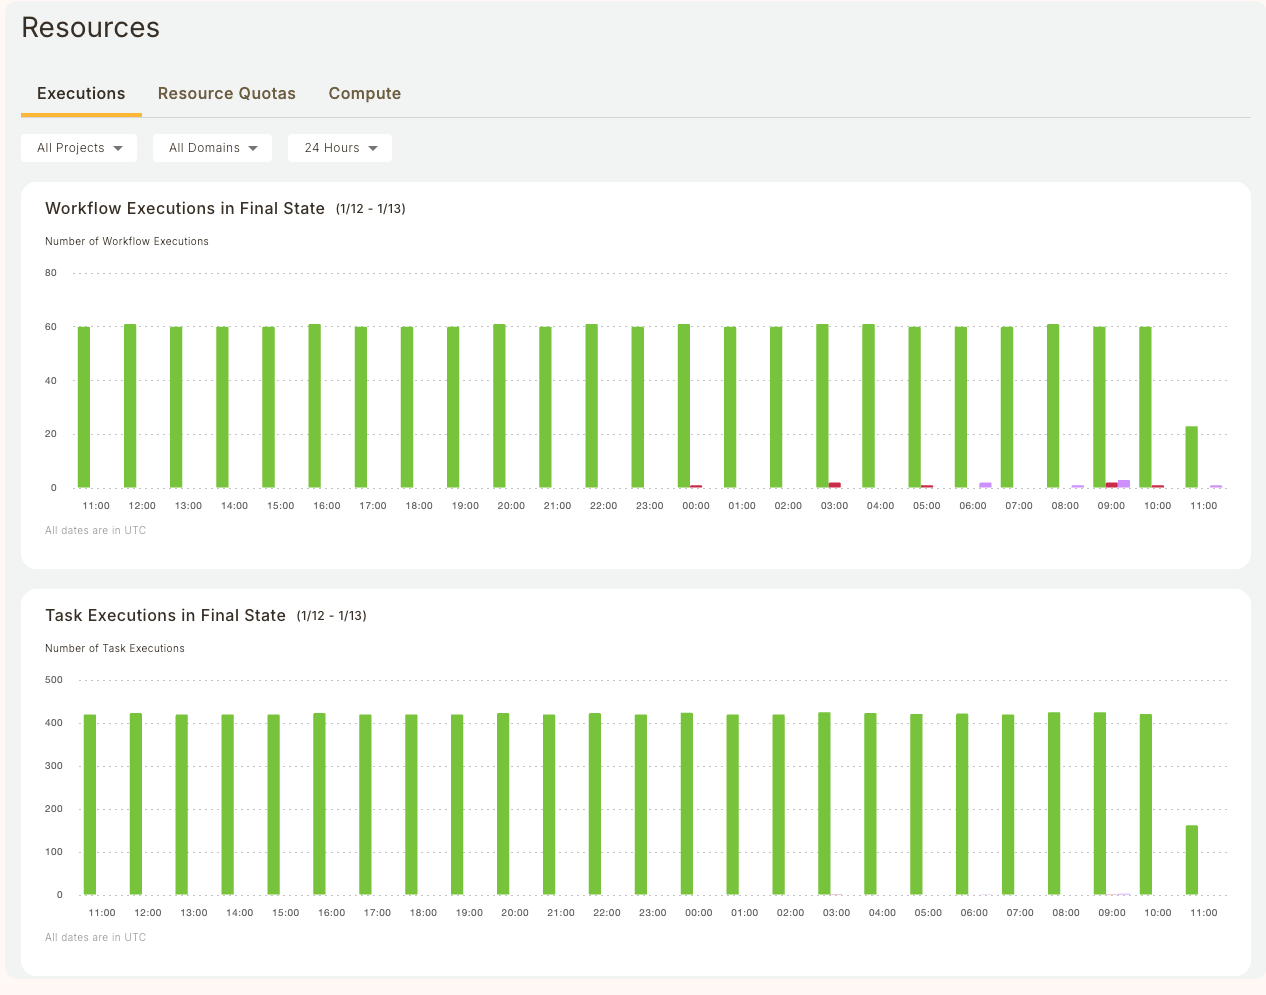
Workflow Executions in Final State#
This chart shows the overall status of workflows at the project-domain level.

For all workflows in the selected project and domain which reached their final state during the selected time period, the chart shows:
The number of successful workflows.
The number of aborted workflows.
The number of failed workflows.
See Workflow States for the precise definitions of these states.
Task Executions in Final State#
This chart shows the overall status of tasks at the project-domain level.

For all tasks in the selected project and domain which reached their final state during the selected time period, the chart shows:
The number of successful tasks.
The number of aborted tasks.
The number of failed tasks.
See Task States for the precise definitions of these states.
Running Pods#
This chart shows the absolute resource consumption for
Memory (MiB)
CPU (number of cores)
GPU (number of cores)
You can select which parameter to show by clicking on the corresponding button at the top of the chart. You can also select whether to show Requested, Used, or both.

Utilization#
This chart shows the percent resource utilization for
Memory
CPU
You can select which parameter to show by clicking on the corresponding button at the top of the chart.

Resource Quotas#
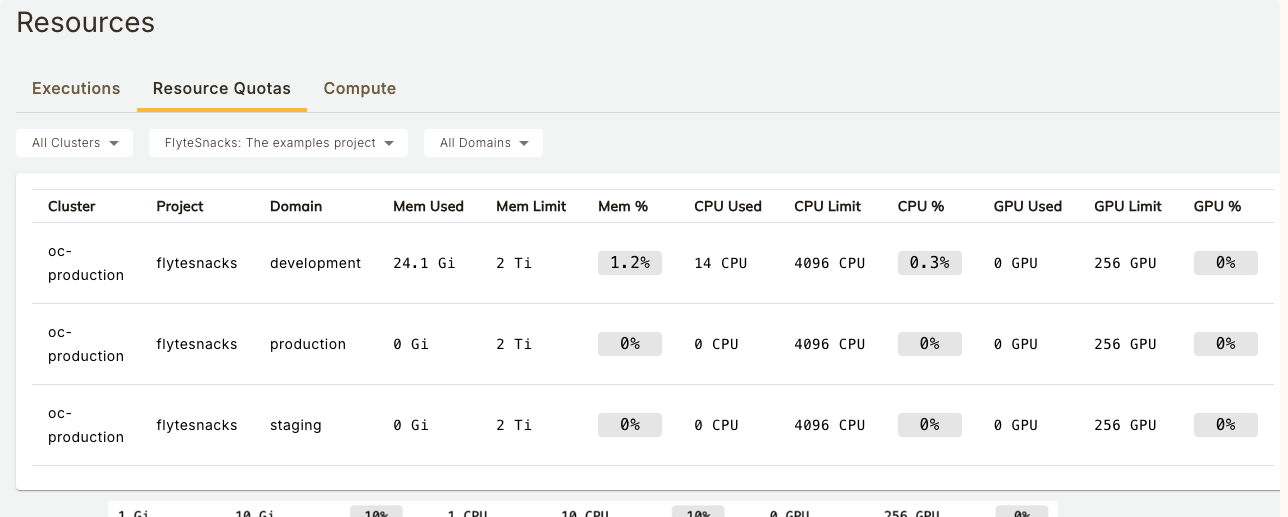
This dashboard displays the resource quotas for projects and domains in the organization.

Namespaces and Quotas#
Under the hood, Union.ai uses Kubernetes to run workloads. To deliver multi-tenancy, the system uses Kubernetes namespaces. In AWS based installations, each project-domain pair is mapped to a namespace. In GCP-based installations each domain is mapped to a namespace.
Within each namespace, a resource quota is set for each resource type (memory, CPU, GPU). This dashboard displays the current point-in-time quota consumption for memory, CPU, and GPU. Quotas are defined as part of the set-up of the instance types in your data plane. To change them, talk to the Union.ai team.
Quota Consumption#
For each resource type, the sum of all the limits parameters set on all the tasks in a namespace determines quota consumption for that resource. Within a namespace, a given resource’s consumption can never exceed that resource’s quota.
Compute#
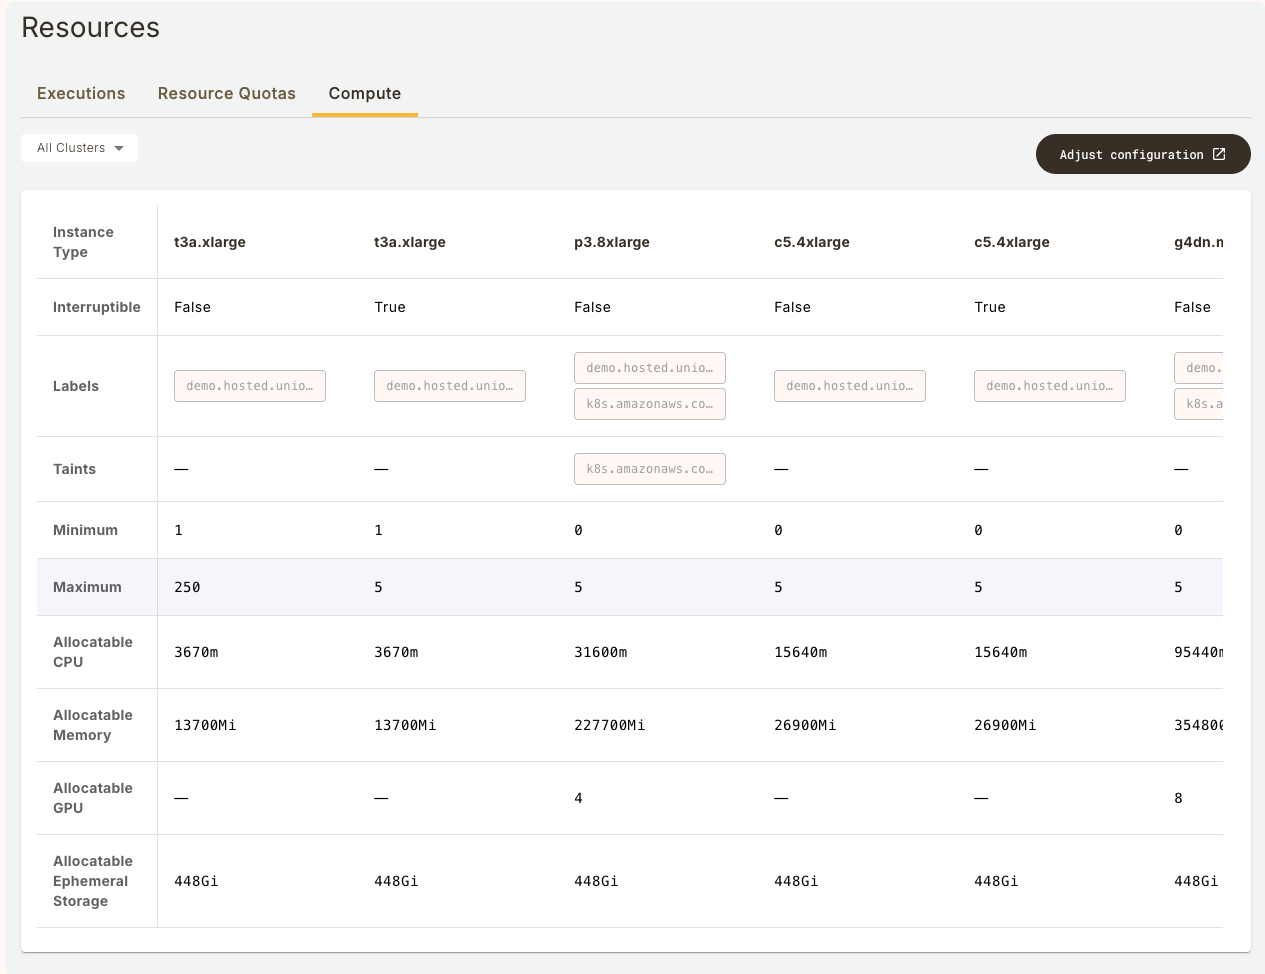
This dashboard displays information about configured node pools in the organization.

Union.ai will schedule tasks on a node pool that meets the requirements of the task (as defined by the requests and limits parameters in the task definition) and can vertically scale these node pools according to the minimum and maximum configured limits. This dashboard shows all currently-configured node pools, whether they are interruptible, labels and taints, minimum and maximum sizes, and allocatable resources.
The allocatable resource values reflect any compute necessary for Union.ai services to function. This is why the value may be slightly lower than the quoted value from the cloud provider. This value, however, does not account for any overhead that may be used by third-party services, like Ray, for example.
Information displayed#
The dashboard provides the following information:
Instance Type: The type of instance/VM/node as defined by your cloud provider.
Interruptible: A boolean. True If the instance is interruptible.
Labels: Node pool labels which can be used to target tasks at specific node types.
Taints: Node pool taints which can be used to avoid tasks landing on a node if they do not have the appropriate toleration.
Minimum: Minimum node pool size. Note that if this is set to zero, the node pool will scale down completely when not in use.
Maximum: Maximum node pool size.
Allocatable Resources:
CPU: The maximum CPU you can request in a task definition after accounting for overheads and other factors.
Memory: The maximum memory you can request in a task definition after accounting for overheads and other factors.
GPU: The maximum number of GPUs you can request in a task definition after accounting for overheads and other factors.
Ephemeral Storage: The maximum storage you can request in a task definition after accounting for overheads and other factors.
Note that these values are estimates and may not reflect the exact allocatable resources on any node in your cluster.
Examples#
In the screenshot above, there is a t3a.xlarge with 3670m (3670 millicores) of allocatable CPU, and a larger c5.4xlarge with 15640m of allocatable CPU. In order to schedule a workload on the smaller node, you could specify the following in a task definition:
@union.task(requests=Resources(cpu="3670m", mem="1Gi"),
      limits=Resources(cpu="3670m", mem="1Gi"))
In the absence of confounding factors (for example, other workloads fully utilizing all t3a.xlarge instances), this task will spin up a t3a.xlarge instance and run the execution on it, taking all available allocatable CPU resources.
Conversely, if a user requests the following:
@union.task(requests=Resources(cpu="4000m", mem="1Gi"),
      limits=Resources(cpu="4000m", mem="1Gi"))
The workload will schedule on a larger instance (like the c5.4xlarge) because 4000m exceeds the allocatable CPU on the t3a.xlarge, despite the fact that this instance type is marketed as having 4 CPU cores. The discrepancy is due to overheads and holdbacks introduced by Kubernetes to ensure adequate resources to schedule pods on the node.